Key Takeaways – Strategic Approach to Analytics
Author’s Note: This blog post is part of the Strategic Approach to Analytics in Salesforce series, which features the strategic approach to analytics of six leaders at Internet Creations. To view the entire series, click here.
As we have learned from IC’s leaders throughout this series of blog posts, a strategic approach to analytics in Salesforce is a crucial puzzle piece to an organization’s success. Making data-informed decisions in your business, empowers you with confidence in your decision making and in the future path of the business. It enables you to inform the uncertainty through data-driven decisions. Without the data and analytics, companies are unable to head in a specific direction with great confidence. But it goes further than that. Strategy is the key word here. You can have the data and even the analytical capabilities, but if you do not have a strategy as to how to approach analytics, then you are giving up potential advantages.
Hopefully, the Strategic Approach to Analytics in Salesforce blog post series has provided you with some helpful ideas and concepts of how to strategically approach analytics. Let’s reflect on the key takeaways from the six blog posts in the series.
Key Takeaways
High-Level Strategic Approach to Analytics
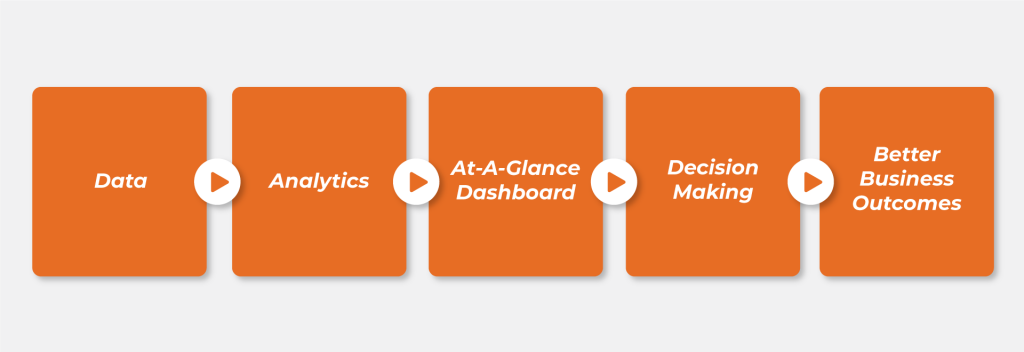
Having dashboards to refer to in your decision-making is important. Most importantly, these dashboards should be purpose-built and have actions you can take as a result of the data. With dashboards, you want to “start with the end in mind.”
Felisa provides a key takeaway by saying, “If leaders build their own dashboards, then they understand the importance of each of the metrics that is on the dashboard and why they’re looking at it.” Enabling your leaders in the organization to have a strong understanding of a dashboard’s purpose, allows them to make better business decisions as a result.
Read more about the High-Level Strategic Approach to Analytics.
Key Metrics to Monitor
While every department has different key performance indicators (KPI) to monitor, they all roll-up and make an impact on the organization’s holistic performance. When it comes to metrics, we speak of leading and lagging indicators. These show early and later insights pertaining to your KPIs. Often, one department’s leading indicator may be another department’s lagging indicator. For example, for Marketing, lead generation and opportunity pipeline are lagging indicators because they represent the goal of the Marketing team’s work. But for Sales, lead generation and opportunity pipeline are leading indicators to their performance towards the sales goal. This interdependency makes cross-departmental collaboration crucial to the success of your business.
Read more about the Key Metrics to Monitor.
Importance of Data Quality
Clean, quality data is the first step towards better decision-making and business outcomes. Without reliable data, your dashboards are less effective. The seven ways recommended by IC’s leaders to fix or avoid bad data include Exception Analytics, Executive Support, Initiatives, Documentation, Training/Callouts, Gamification, and Easier Data Entry.
The key point here is that the focus to ensure better data quality should be placed on your people’s behavior. If you can make the instructions and experience of data entry as easy and clear as possible, then you enable your users to take ownership of the data. This in turn helps your business make better decisions based on the data.
Read more about the Importance of Data Quality.
Confirmation Bias
Confirmation bias is when you approach analysis or research with a preconceived idea of what the results will be, which can influence your work. This is negative because you are making decisions based on your own opinions (bias) as opposed to approaching your research and analysis with an open mind and allowing your findings to influence your decision making.
Some of the ways that IC leaders actively work against confirmation bias include asking why and challenging assumptions, getting others’ perspectives, being the change you want to see, getting more data, challenging your data, listening before forming an opinion, and using trial and error.
Read more about Confirmation Bias.
Tips and Traps with Analytics
The IC leaders shared a lot of excellent tips and traps with analytics in Salesforce. Check out the blog post for the full list. I have included some of the best tips below.
- Keep reporting in mind when designing the data model. You need to make sure the data model will support the reporting needs of your business.
- Make sure there is a next action to be taken for every report.
- Rename the dashboard component titles to be questions. This acts as a reminder of the goals you are working towards.
- There is a point where Salesforce cannot do what you want it to do when it comes to analytics. Learn the limitations, so you don’t waste time trying to make it work in Salesforce, when Excel could solve your problem more quickly.
- Review your dashboard frequently, not just when you need to make a decision. Frequent review might give you some new insights serendipitously.
Read more about Tips and Traps with Analytics.
Cross-Departmental Collaboration and Alignment
Collaboration and alignment across various departments at your organization is crucial to your success. Without it, everyone would operate in silos. The overall company’s goals can be broken down between each department. Ultimately, every department in the company is working towards the overall success of the business as a whole.
The way to ensure cross-departmental collaboration and alignment starts with the strategic planning of the company’s and each department’s goals at the annual off-site meeting. Throughout the year, there are bi-weekly check-ins to discuss high-level goals and challenges together. Joint dashboards are useful to be on the same page on shared KPIs. There are other ad-hoc or weekly meetings between department leaders that work frequently together, such as Sales and Marketing, or Product and R&D. Naturally, organic collaboration should be maintained in addition to these more structured meetings.
Read more about Cross-Departmental Collaboration and Alignment.
Conclusion
My hope is that you have gained new insights and learned something new about analytics as a result of this blog post series. Many thanks to the leaders at Internet Creations for allowing me to interview them and for sharing their expertise with us. It is never too late to examine the role that analytics plays at your organization. The value of a strategic approach to analytics should not be underestimated. It can be the cornerstone to your future success.
If you would like support in crafting an analytics strategy in Salesforce, please reach out to us at Internet Creations. We would be happy to assist you.
- Key Takeaways – Strategic Approach to Analytics - February 10, 2021
- Cross-Departmental Collaboration and Alignment - February 2, 2021
- 22 Tips and Traps with Analytics (with Admin Best Practices) - January 12, 2021
