Troubleshooting Tips: Debug Logs Demystified
Whether you are an admin or support agent looking to troubleshoot something not working as expected, like records not saving or jobs failing, or you are a developer working to identify an issue with code, debug logs play an important role to get to the root cause of an issue.
Some of the useful information debug logs provide are:
- Workflows / Process / Triggers that ran
- Record insertions / Updates / Deletions
- Validation errors
- Limit Usage (# of queries, # of query rows, DMLs, CPU time) (https://developer.salesforce.com/docs/atlas.en-us.apexcode.meta/apexcode/apex_gov_limits.htm)
- Code Exceptions
- Web Service Callouts
Below is a collection of strategies and tactics I use to collect and debug logs, analyze them, and everything in between!
1. Collecting a Log
Collecting a debug log is easy, and there is more than one way to do so.
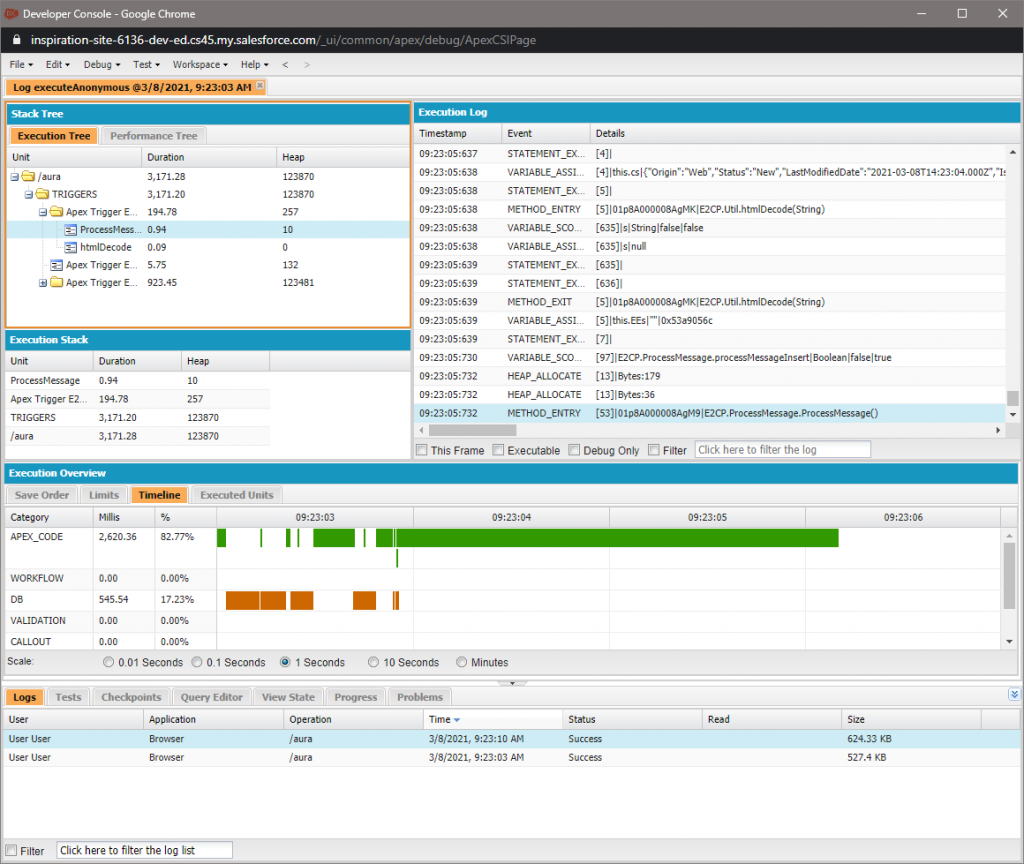
- If you just need a quick log for the current user, the easiest way is to simply click the top gear icon and then pop open the developer console and click on the Logs tab which will automatically begin log collection. Once you double click a log in the list to view it, you can leverage the Search, Debug Only, and other filters to quickly zero in on the relevant log details. Additionally, the Debug | Switch Perspective menu has some handy views to gain more insight such as Analysis View which shows an execution timeline, tree, and other useful break-downs.
- To collect a log for someone else, or if an issue does not happen on demand, go to Setup and do a Quick Find on Debug Logs. There one can add a trace flag for a specific user during a specified timeframe. Although you can create a new Debug Level which determines what information is collected by the log, to get the same defaults used by the developer console one can select the SFDC_DevConsole debug level. As a developer there are also other ways such as through Visual Studio Code as well.
2. Choosing the Right Log to Review
Be mindful that once you enable log collection for a user that several logs will begin to appear, which can make it tricky to know which one you are after. Pro tip: it is generally a good idea to enable logs right before an action is performed if it can happen on demand so you can start with a smaller list to scroll through.
Pro tip: it is generally a good idea to enable logs right before an action is performed if it can happen on demand so you can start with a smaller list to scroll through.
Sometimes performing a single action can generate a few logs as well. This can happen as components on a record detail begin to pull in fresh data immediately after the action is performed for example. A good strategy I generally find is to go for the logs that appeared first when the action was performed rather than the most recent one. Most of the time the log you want will be a larger one rather than one that is comparatively empty. Additionally, you can look at the Operation column which may have ”/aura” if you edited a record in lightning or “/RECORD_ID/e” in classic.
3. What to Search For
Now that you have the log, below are some handy search terms I use to quickly identify if there is a problem as well as some other issues that could arise. Although it is common to find the error toward the bottom of the log, it is important to note that the last thing to execute is not always where the problem occurred. In fact, I typically look at what precedes the error to get a better picture of what executed prior; whether it be a workflow field update, trigger, or flow. Here are search terms of keywords to look for in the debug log:
- “VALIDATION_FAIL”
- General validation failure while saving a record
- “FIELD_CUSTOM_VALIDATION_EXCEPTION”
- Field validation rule or custom apex field validation failure while saving a record
- “EXCEPTION_THROWN”
- Most often caused by code errors such as:
- NullPointerException: Attempt to de-reference a null object
- List has no rows for assignment to SObject
- Most often caused by code errors such as:
- “System.LimitException”
- For example:
- Too many SOQL queries: 101
- Too many DML statements
- Apex CPU time limit exceeded
- Too many queueable jobs added to the queue
- For example:
- “USER_DEBUG”
- Developers often output useful information to the log (when exceptions are thrown and caught for example).
- “CODE_UNIT_STARTED” / “CODE_UNIT_FINISHED”
- Search backward from the error to find what was running when the limit or exception occurred
- “SOQL_EXECUTE_BEGIN” / “SOQL_EXECUTE_END”
- The SOQL query that was used will typically show along with the number rows returned
- “DML_BEGIN” / “DML_END”
- Search for this to identify if a record was inserted, updated, or deleted
- “CUMULATIVE_LIMIT_USAGE”
- How close to the Salesforce Governor Limits you are getting at that point of the execution
- How close to the Salesforce Governor Limits you are getting at that point of the execution
4. Troubleshooting LIMIT Exceptions
System.LimitException is a great example where the last thing to execute may not be the cause. For example, the SOQL query limit may be exceeded if triggers are firing multiple times as a cascade of down-stream triggers update related records (which is especially common in larger organizations having a lot of customization). In this scenario, it is not a bad idea to look for DML_BEGIN in the log to see if there are any updates that could have been avoided (unnecessary DMLs would likely cause additional triggers to fire and use up more SOQLs). Checking the updates can also rule out any sort of update loop such as a User / Contact sync trigger going back and forth endlessly.
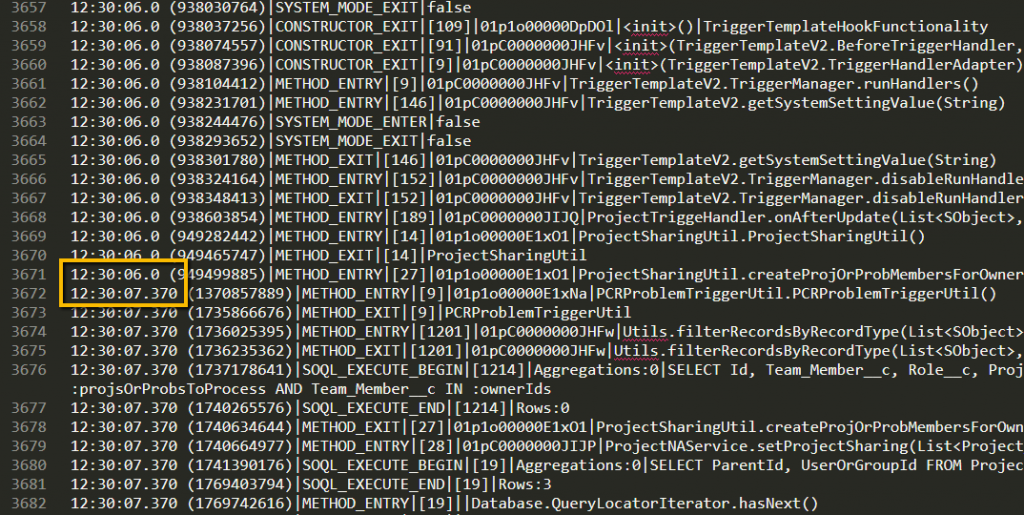
Another good example is the Apex CPU time limit which could be caused by slow running code such as a long running callout or a global describe in an org with a lot of objects, especially if it executes more than once. Fortunately, it is easy to identify long running items by simply scrolling through the log while looking for any sudden jumps in the timestamp that appears to the left of each line in the log:
5. Use Log Filters to Reduce the Log Size
Sometimes the debug log may get too long. When this happens the log will be missing information and contain the line ”*** Skipped xxxbytes of detailed log”. Simply search for ”Skipped” though since the number of bytes skipped will vary. When this occurs you will need to edit the log Filters / Debug Level to reduce the amount of information collected and reduce the size of the log. For example, the ”System” category tends to generate a lot of lines that are not very useful so I might reduce that and any other categories I am not currently interested in.
For more troubleshooting tips, check out “Developer Console for Admins”, from Lead Consultant, Rachel Garton! The Developer Console pulls together development and debugging tools into one place, taking the troubleshooting features you already have and extending them.

- Troubleshooting Tips: Debug Logs Demystified - March 15, 2021
- Ride the Lightning: Tips for Building Salesforce Lightning Web Components - January 14, 2020


